Struggling to find the balance between too much inventory and too little? Learn how to calculate and maintain optimal stock levels for your business.
At a Glance
- Keep enough stock to meet demand without tying up cash in excess inventory.
- Use data and forecasting to guide purchasing and replenishment decisions.
- Leverage ERP tools like DAC for automation, alerts, and visibility.
- Review and refine continuously—optimization is an ongoing process.
Why Stock Optimization Matters in Convenience Distribution
For convenience distributors, balancing inventory is a constant challenge. Too much stock ties up capital and risks spoilage. Too little, and customers experience stockouts that can disrupt store operations.
The sweet spot lies in carrying just enough inventory to meet customer demand while minimizing costs. Every product—from bottled beverages to snack items—has its own sales rhythm, seasonality, and replenishment needs.
This guide explores how convenience distributors can calculate optimal stock levels, what factors influence those calculations, and how ERP systems help automate and simplify the process.
The Unique Stocking Challenge for Convenience Distributors
Unlike traditional wholesalers, convenience distributors deal with:
- A high number of SKUs moving at different speeds.
- Frequent, smaller orders from multiple retail locations.
- Short product shelf lives and highly variable demand.
Add in promotions, supplier lead times, and regional buying patterns, and keeping the right stock balance becomes incredibly complex.
The bottom line: Traditional “rule of thumb” methods fall short. The most successful distributors use data-driven insights and ERP systems to analyze trends, anticipate needs, and adjust reorder points dynamically.

What Really Drives Optimal Stock Levels
Before you can calculate ideal inventory quantities, you need to understand the main variables that shape them.
1. Demand Forecasting
Accurate demand forecasting starts with data. By reviewing historical sales, promotions, and market trends, distributors can better estimate what customers will order next. Forecasting doesn’t eliminate uncertainty—but it reduces guesswork and supports smarter planning.
2. Lead Times
Lead time is how long it takes for a supplier to deliver after you place an order. Longer or inconsistent lead times increase the need for buffer stock. Tracking average and maximum lead times helps determine when to reorder and how much flexibility you need.
3. Safety Stock
Safety stock is your insurance policy against surprises. It cushions against demand spikes or supplier delays.
Formula: Safety Stock = (Max Daily Usage × Max Lead Time) − (Avg Daily Usage × Avg Lead Time)
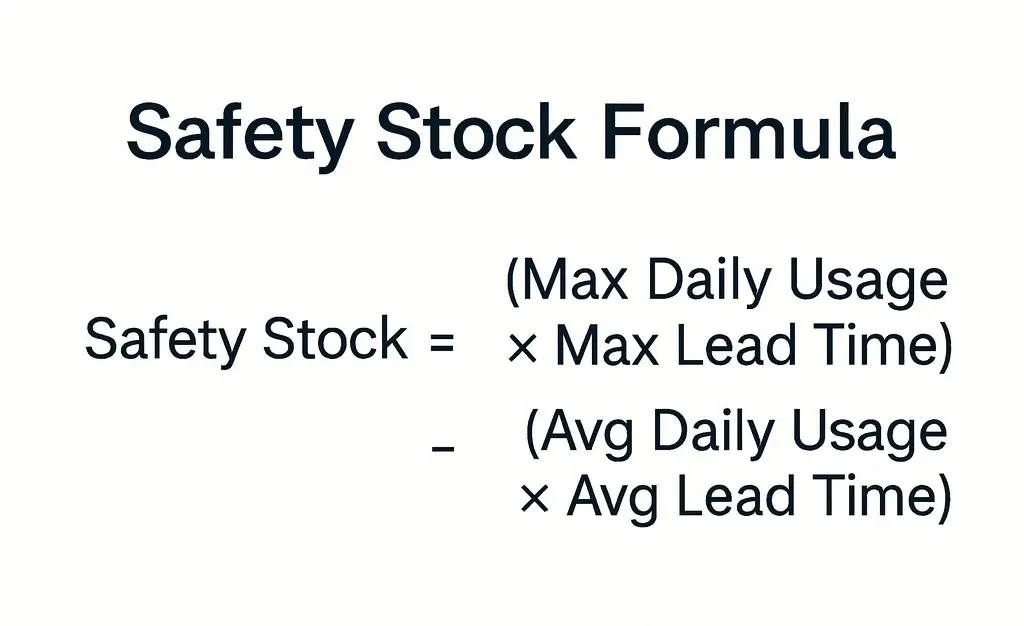
ERP systems like DAC support data capture and analysis for these calculations, though distributors must maintain accurate usage and lead time data.
4. Carrying Costs
Inventory comes with costs—storage, handling, depreciation, and shrinkage. Monitoring these costs helps you balance profitability with service levels.
5. Service Level Targets
Your desired service level determines how often you’re willing to risk a stockout. Higher service levels mean fewer shortages but more carrying costs. The right balance depends on your customer expectations and margin goals.
In short: Understanding these factors helps you move from reactive ordering to proactive planning.
A Step-by-Step Way to Calculate the Right Inventory Levels

Optimizing stock levels requires both math and management discipline. Here’s a simple method to get started:
Step 1: Analyze Demand Data
Review your historical sales to identify average daily usage and demand patterns. Look for seasonality, promotions, and fast-moving items.
Step 2: Determine Reorder Points
Your reorder point is the inventory level that signals when it’s time to restock.
Formula: Reorder Point = (Avg Daily Usage × Lead Time in Days) + Safety Stock
ERP systems can help track this automatically once thresholds are configured.
Step 3: Set and Adjust Safety Stock Levels
Use your historical data to calculate a baseline safety stock. Adjust as conditions change—especially for perishable or high-demand items.
Step 4: Continuously Review and Refine
Inventory optimization isn’t one-and-done. As market conditions shift, review performance regularly.
Tip: With DAC’s Chart Manager and live dashboards, you get real-time visibility into product, vendor and customer metrics — helping you monitor inventory levels, track turnover and sales trends, and trigger replenishment actions when stock falls below your configured thresholds..
The takeaway: Data and discipline go hand in hand—technology makes both easier to manage.
How ERP Systems Simplify Stock Optimization
Managing inventory across multiple warehouses and customers is complex—but ERP systems bring clarity. By centralizing data and automating repetitive processes, ERPs help distributors maintain control and agility.
How ERP Systems Improve Inventory Control
- Up-to-Date Visibility: View stock across locations in one dashboard. Identify low inventory, overstocks, or fast-moving products instantly.
- Demand Forecasting Support: Analyze historical sales data to forecast demand more accurately and plan replenishment with confidence.
- Automated Replenishment Triggers: Receive real-time alerts or initiate purchasing processes when stock falls below configured thresholds.
- Supplier Management: Track supplier performance and lead times to anticipate potential delays.
- Data-Driven Decisions: Dashboards show turnover, inventory value, and stock aging so you can evaluate carrying-cost and service-level trade-offs.
Here’s why that matters: With integrated data and automation, you can focus less on manual tracking and more on strategic purchasing and service performance.
How CDR Software Helps Convenience Distributors Optimize Inventory
At CDR Software, we know convenience distribution is fast-paced and detail-driven. That’s why DAC was built with this industry in mind—combining flexibility, automation, and analytics to help you stay lean and responsive.
How DAC Supports Smarter Inventory Management
- Data-Driven Forecasting: DAC uses historical sales data and trend analysis to support demand forecasting and help you plan replenishment more accurately.
- Automated Alerts and Purchasing Processes: Get real-time alerts when stock falls below configured reorder thresholds. Certain workflows can also automate purchase-order creation to streamline routine buys.
- Supplier and Product Insights: Evaluate supplier reliability and product performance to improve purchasing strategies and reduce shortages.
- Dashboard-Driven Visibility: Interactive dashboards and reporting tools show turnover, inventory value, and stock aging—helping you weigh carrying costs and service-level trade-offs.
With DAC, distributors gain the tools to forecast smarter, automate confidently, and maintain visibility—all while staying in control of final purchasing decisions.
Key Takeaways
- Use your data. Historical sales, lead times, and demand patterns guide smarter inventory planning.
- Set and monitor reorder points. ERP systems can track and alert you, but accurate inputs are essential.
- Leverage ERP dashboards. Real-time insights support ongoing review and continuous improvement.
- Balance cost and service. Monitor turnover, stock value, and fill rates to maintain healthy margins.
- Partner with purpose. Choose an ERP built for convenience distribution to align with your operations and goals.
Finding the Right Balance
Optimizing stock levels isn’t about perfection—it’s about consistency and control. Small, data-informed improvements can make a major impact on profitability, warehouse efficiency, and customer satisfaction.
With DAC, convenience distributors gain real-time insights, demand forecasting support, and automated purchasing tools—all built to simplify the complexity of modern distribution.
The result: You carry the right products, in the right quantities, at the right time—every time.
Ready to see it in action? Schedule a demo today and discover how DAC helps optimize inventory across your entire operation.
FAQs
What’s the difference between safety stock and reorder point?
The reorder point tells you when to place a new order, while safety stock is the extra buffer that protects you from demand spikes or supply delays.
How can ERP systems improve demand forecasting?
ERP systems use historical data and trend analysis to support more accurate forecasts—reducing reliance on manual estimates.
What’s a good inventory turnover rate for convenience distributors?
It varies by product, but higher turnover generally means healthier inventory management. Fast-moving goods may turn several times per month.